Industrial Real Estate Market: The Decade In Review
As we continue to move forward into 2020, we are simultaneously taking the time to reflect back on the 2010s. Over the course of the last decade, a significant amount of change and growth occurred within Northeast Ohio’s commercial real estate market—especially within the region’s industrial market.
Below, we dive into some of the most notable trends and changes in Northeast Ohio’s industrial market between 2010 and 2019. These figures can be helpful for predicting upcoming market conditions and identifying emerging trends.
Recent Increase in New Construction & Leasing Activity
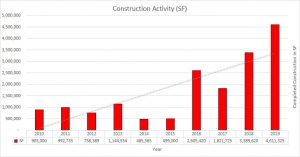
The Northeast Ohio market currently tracks more than 13,000 industrial buildings, totaling 508 million square feet (msf). New construction during the last decade totaled 17.2 msf, with 46% of that amount occurring within the last two years. Additionally, the 4.6 msf added to the market in 2019 was greater than all of the new construction that occurred between 2010 and 2015 combined.

Meanwhile, the industrial market saw 42.4 msf of leasing activity over the decade, with an average of 4.2 msf per year. 2019 dominated the other years, with a whopping 8.6 msf in leasing activity. This figure represents a significant jump from 2018 leasing activity at 5.1 msf, and from 2017 activity at 4.6 msf.

While the decade as a whole shows a steady and gradual increase in these figures, it’s interesting to note that 2019 showcased a more dramatic increase than most other years.
Steady Drop in Vacancy Rates
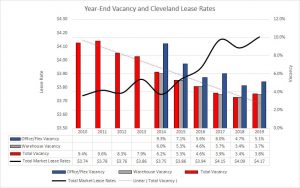
In 2010, the total vacancy rate for the Northeast Ohio market was 9.4%. This figure represents the percentage of all available properties or units that are vacant at a given point in time. After a brief spike to 9.6% in 2011, this number continued to decline throughout the decade, reaching 5.3% by 2015.
By the end of 2019, the market vacancy rate had further declined to 3.8%. Over the course of the decade, this represents a 85% drop in vacancy rates—highly promising news for real estate investors. 2018 actually holds the record for the lowest vacancy rate in Northeast Ohio history at 3.4%.

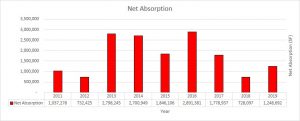
Yearly net absorption was positive for nine consecutive years during the decade, with 2010 as the lone exception due to the closing of a large automotive facility.

Investor vs. User Sales Activity Converges
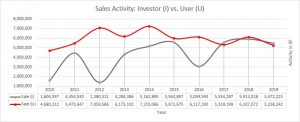
In 2019, user sales activity totaled 4.7 msf—crushing total investor activity at 1.6 msf. Both types of customers saw ups and downs throughout the decade, though investors experienced sharper inclines and declines.
By 2015 user and investor sales activities were nearly equal, at 6.0 and 5.6 msf, respectively. In 2017, investor sales activity surpassed user activity for the first time in the decade, with users at 5.3 msf and investors at 5.6 msf.
The two groups have remained neck and neck throughout the end of the decade, totaling 5.2 msf for users and 5.5 msf for investors in 2019. Total user sales activity in 2019 also came in below the decade average of 5.9 msf, whereas total investor activity in 2019 came in above the average of 4.2 msf.

Although the years between 2010 and 2019 certainly had their fair share of ups and downs, overall the industrial real estate market in Northeast Ohio experienced significant growth across the board. Many new opportunities for commercial investments have opened up in recent years, yet competition among investors has increased as well.
Interested in purchasing or leasing industrial space in Northeast Ohio? View our current industrial properties for sale or lease, or contact a member of our team today for more information.
To learn more about how CRESCO, Greater Cleveland’s leading commercial real estate company, can help you with your property needs, contact us at 216.520.1200, or fill out the form below. A CRESCO professional will contact you shortly.